Computer vision occupancy detection has been in commercial parking deployments long enough to generate real performance data — not just vendor benchmarks, but operational numbers from facilities that have run these systems through full seasonal cycles, event days, and the unpredictable conditions of actual parking environments. The results are genuinely promising in some dimensions and honestly humbling in others.
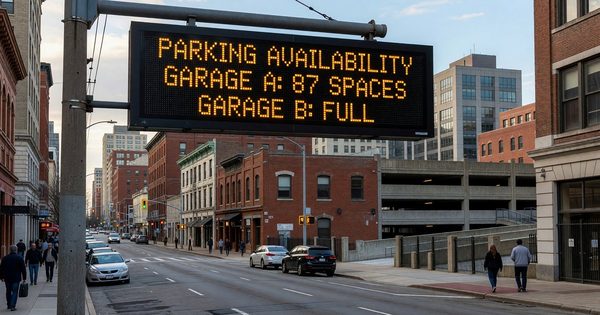
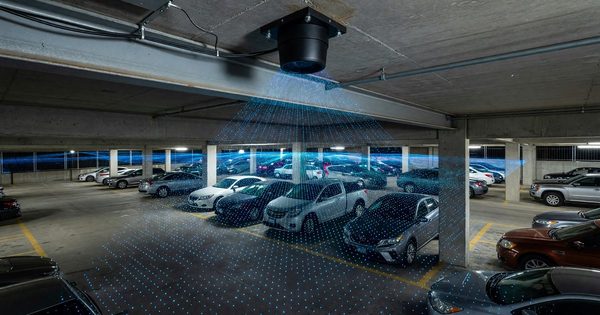
The basic proposition is straightforward: mount cameras to cover parking spaces, run deep learning models on the video feed, classify each space as occupied or vacant in real time. One camera can cover what would require 20 or more individual magnetometer sensors. The economics look attractive on paper. The question is whether the computer vision performance holds up at production scale across the full range of conditions a parking facility experiences.
This article looks at what modern computer vision systems can reliably do in parking occupancy detection, where they consistently struggle, and how operators should think about evaluating systems against their specific deployment environment.
How Modern CV Occupancy Models Work
Contemporary parking occupancy detection models are overwhelmingly based on convolutional neural networks (CNNs), with more recent implementations using transformer-based architectures like Vision Transformers (ViT) or hybrid CNN-transformer approaches.
The training process for a parking-specific model involves exposing the neural network to hundreds of thousands of labeled images covering diverse conditions: different vehicle types, different lighting conditions (overcast, direct sun, nighttime, shadows from columns or trees), different occupancy patterns, and different camera angles. The model learns to identify features that reliably distinguish “space occupied by vehicle” from “empty space” across this variation.
Inference — the process of running new camera frames through the trained model and classifying each space — happens in real time on edge hardware (a local compute node in or near the facility) or on cloud infrastructure. Frame rates for occupancy applications are typically 1 to 5 frames per second — far lower than security camera applications — since occupancy status does not change at video speed and lower frame rates reduce compute and bandwidth requirements substantially.
Space Definition and Calibration
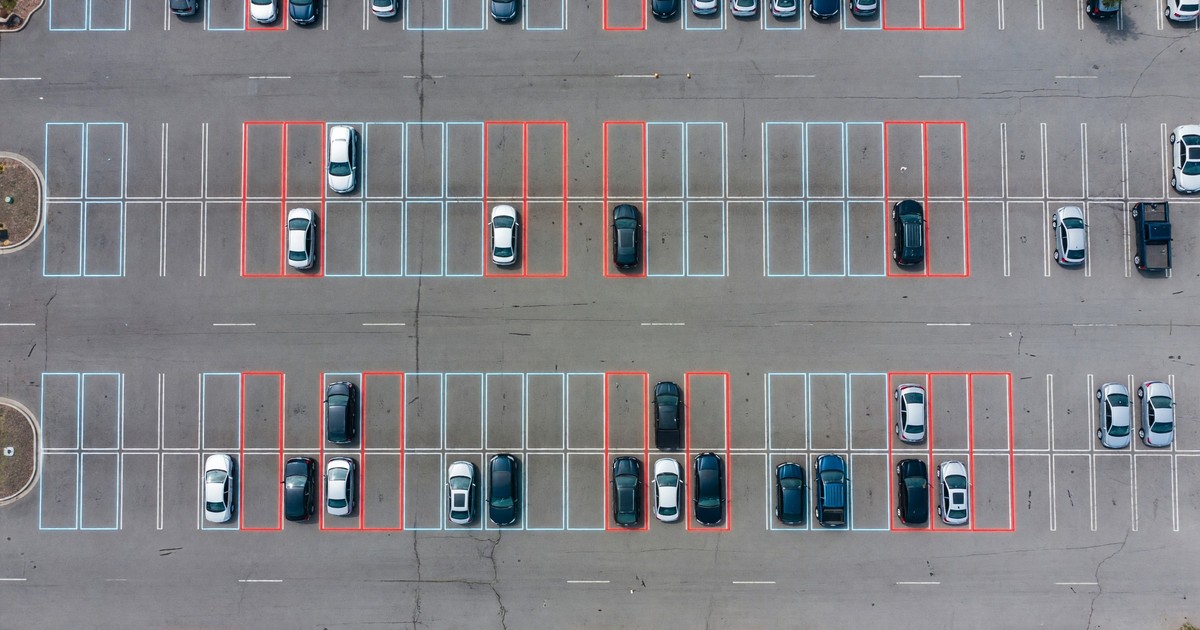
A key setup step that affects all subsequent performance is space definition: telling the model which regions of the camera image correspond to which parking spaces. This is typically done through a configuration interface where an operator or technician draws bounding polygons on a reference camera frame for each space.
The quality of this calibration matters significantly. Poorly drawn bounding boxes — too large (overlapping neighboring spaces), too small (missing the vehicle’s position in the space), or misaligned with the actual space boundaries — produce systematic accuracy errors that no amount of model quality can overcome.
Calibration also needs to account for camera perspective distortion. Spaces near the camera appear larger and at different angles than spaces at the edge of the frame. Good calibration tools compensate for this mathematically; inadequate tools require manual adjustment space by space.
What CV Systems Detect Reliably
Standard Vehicles in Adequate Lighting
In good lighting conditions with proper calibration, modern CV models reliably detect the presence of standard passenger cars, SUVs, and light trucks with accuracy rates of 97 to 99 percent. This performance is well-established and reproducible across commercial deployments from multiple vendors.
For parking guidance and utilization analytics applications — where the objective is an accurate count of available spaces, not individual space-level accuracy — this baseline performance is typically sufficient. Small numbers of misclassified individual spaces wash out at the aggregate level.
Partial Occlusion
Modern models are trained on images where vehicles partially overlap their assigned space boundaries, are partly hidden by columns, or are obscured by other vehicles. Within typical parking geometry, CV models handle partial occlusion reasonably well — significantly better than magnetometers, which can produce inconsistent reads when a vehicle straddling a space boundary distorts the magnetic field in two adjacent spaces simultaneously.
Vehicle Type Diversity
Training datasets for commercial parking CV models typically include motorcycles, bicycles, scooters, commercial vans, and pickup trucks alongside standard passenger vehicles. Classification accuracy varies by vehicle type: motorcycles and bicycles are the most frequently misclassified category, though accuracy on these has improved substantially as vendors have specifically expanded training data for two-wheeled vehicles.
Where CV Systems Consistently Struggle
Night and Adverse Lighting Transitions
Lighting is the most significant accuracy challenge for camera-based systems. Modern models perform significantly better in low light than older generation systems, and infrared illumination (using cameras with IR LEDs for nighttime imaging) can partially compensate. But performance typically degrades by 3 to 8 percentage points in challenging lighting compared to optimal conditions.
The most difficult scenario is not consistent darkness but transition conditions: the minutes around sunrise and sunset when direct sunlight creates extreme contrast between lit and shadowed spaces, or when vehicle headlights in a dark structure create bright blooms that obscure space boundaries. These transition windows are often brief but occur daily and represent predictable accuracy degradation periods.
Glare and Wet Surface Reflections
Rain on a parking surface creates specular reflections that can make empty spaces appear to contain objects. Morning sun on wet pavement produces high-contrast patterns that challenge models trained primarily on dry-surface images. These are known failure modes, and operators in climates with significant rainfall or winter sun angles at low elevation should specifically ask vendors for performance data under wet conditions.
Non-Standard Space Geometries
CV models perform best on rectangular, clearly delineated parking spaces with consistent dimensions. Non-standard geometries — circular lots, heavily angled arrangements, spaces marked only by wheel stops rather than painted lines, or spaces where lines have faded — produce higher error rates. Operators with these conditions should request on-site testing rather than relying on aggregate accuracy specifications from other deployments.
Debris, Shopping Carts, and Persistent Objects
A persistent object in a space — a shopping cart left overnight, a traffic cone, a pile of snow pushed into a corner of a space — can cause the model to classify that space as occupied continuously. This is technically correct behavior (something is in the space) but incorrect from a parking availability standpoint. Most production systems address this through time-based logic: if a space has been classified as “occupied” continuously for longer than the facility’s maximum dwell time, it may flag for human review or apply a different classification.
This is not a flaw in the CV model itself but a limitation of the binary “occupied/vacant” framing that most systems apply. More sophisticated systems include a third classification — “object present, may not be vehicle” — with separate handling logic.
Accuracy Claims and How to Evaluate Them
Published accuracy claims for parking CV systems require careful interpretation. The number that matters operationally is not peak accuracy under optimal conditions — it is accuracy across the full distribution of conditions the facility experiences over a 12-month period.
Specifically, ask vendors for:
- Accuracy stratified by lighting condition (bright day, overcast, dusk/dawn, night)
- Accuracy stratified by weather condition (dry, wet, snow-covered)
- False positive and false negative rates separately, not blended into a single accuracy number. False positives (empty space classified as occupied) have a different operational impact than false negatives (occupied space classified as vacant) and matter differently for different use cases.
The Transportation Research Board’s parking research database at trb.org includes independent evaluations of occupancy detection technologies from several DOT-funded field studies — a useful benchmark against vendor-provided specifications.
Deployment Architecture Choices
Edge vs. Cloud Processing
Processing camera feeds at the edge — on a local compute node in the facility — provides lower latency, reduces bandwidth requirements (only occupancy determinations, not video feeds, leave the facility), and keeps video data local (reducing privacy exposure). Cloud processing offers easier updates, centralized management across multiple facilities, and access to more powerful compute for demanding models.
Most commercial parking CV systems today use edge computing for occupancy classification and cloud services for platform management, analytics, and model updates. This hybrid architecture balances the latency and privacy advantages of edge processing with the manageability of cloud infrastructure.
Camera Density and Coverage Planning
One of the genuine economic advantages of camera-based CV is the ability for a single camera to cover multiple spaces. In practice, coverage ratios depend on camera height, field of view, and space geometry. In structured parking with ceiling heights of 10 to 15 feet, overhead cameras typically cover 6 to 15 spaces per unit. In surface lots with pole-mounted cameras at 20 to 30 feet, coverage can extend to 20 to 40 spaces per camera.
The key planning variable is ensuring that the spaces at the edges of each camera’s field of view are covered with sufficient image resolution for reliable classification. Spaces at the periphery of a camera’s view have lower pixel density and suffer more perspective distortion than centrally positioned spaces. Coverage planning should include overlap between adjacent cameras to avoid low-resolution edge-zone accuracy degradation.
Integration With Occupancy Analytics
CV occupancy data becomes more valuable when integrated with broader analytics platforms that connect space-level classifications to business outcomes. The questions that matter operationally are not “which spaces are occupied” but “what is utilization at zone level,” “how does occupancy correlate with revenue,” and “where do availability gaps occur relative to entry points.”
For guidance applications, CV data feeds real-time and predictive space count displays as described in related work on AI-powered parking guidance systems. For utilization analytics, timestamped occupancy records enable the kind of pattern analysis covered in the parking utilization studies guide.
The value of CV is not in the camera image — it is in the time-series occupancy dataset that the camera enables. Operators who deploy CV without clear downstream data applications are collecting data for its own sake. The ROI case requires specific use cases: enforcement support, guidance, utilization analysis, pricing optimization, or some combination.
Where Computer Vision Fits in the Sensor Landscape
Computer vision is the right primary sensor approach for facilities where: (a) the per-space cost of individual sensors is prohibitive, (b) camera infrastructure already exists or is being installed for security purposes, (c) vehicle type classification beyond basic presence detection has operational value, and (d) lighting and weather conditions are manageable.
It is a less appropriate primary approach for: outdoor surface lots with highly variable weather and lighting; facilities with high proportions of motorcycles and scooters; environments with strong privacy requirements around video data; and facilities where the existing structure makes camera mounting and connectivity difficult.
For many facilities, the right answer is hybrid: camera-based CV for broad coverage in well-lit sections, with individual sensors in problem zones that cameras cannot reliably cover. The operators achieving the best long-term accuracy and ROI are those who treat the sensor layer as a portfolio of complementary technologies rather than a single-solution decision.
Related reading: LiDAR Sensors in Parking Facilities for an alternative high-accuracy detection approach, and Parking Demand Forecasting with Machine Learning for how occupancy data feeds predictive analytics.
Frequently Asked Questions
How many parking spaces can one camera monitor?
In structured parking with ceiling heights of 10 to 15 feet, overhead cameras typically cover 6 to 15 spaces per unit. In surface lots with pole-mounted cameras at 20 to 30 feet, coverage can reach 20 to 40 spaces per camera. Coverage ratio depends on camera field of view, mounting height, space geometry, and the acceptable accuracy at the frame edges. Manufacturers provide site-specific coverage estimates based on facility plans.
What accuracy do commercial computer vision parking systems achieve?
In good lighting with proper calibration, modern CV systems achieve 97 to 99 percent accuracy for standard vehicles. Overall production accuracy across a full day, including lighting transitions and adverse weather, typically ranges from 93 to 97 percent for well-configured deployments. Ask vendors for accuracy data stratified by lighting and weather conditions, not just peak-condition benchmarks.
Can computer vision parking systems work at night?
Yes, with appropriate camera hardware. Cameras equipped with infrared (IR) illumination can capture usable images in complete darkness, and modern CV models trained on IR imagery perform reliably in low-light conditions. The most challenging periods are typically dusk and dawn transitions, when high contrast between lit and shadowed areas creates difficulty for models trained predominantly on consistent lighting.
Does camera-based occupancy detection raise privacy concerns?
Yes — camera systems capture images that may include people and license plates, triggering data protection obligations in some jurisdictions. Most commercial systems include privacy mitigation features such as on-device processing (video never leaves the facility), automatic deletion of captured images after classification, and face and plate blurring in stored images. Operators should conduct legal review of their CV data practices for the relevant jurisdiction before deployment.
How does CV occupancy detection compare to magnetometer sensors in cost?
Computer vision typically has a lower per-space hardware cost for large deployments because one camera covers multiple spaces. Installation costs are lower for camera-based systems in structures where ceiling mounting is straightforward. However, CV systems require more powerful edge compute hardware than magnetometer gateways, and camera maintenance (cleaning, recalibration) is more involved than battery replacement for in-ground sensors. Total cost of ownership comparison depends heavily on facility size and existing infrastructure.
What causes computer vision parking systems to misclassify spaces?
The most common misclassification causes are: adverse lighting (direct sun, headlights, deep shadows), wet surface reflections, non-standard space markings, partial occlusion by columns or neighboring vehicles, and persistent non-vehicle objects (shopping carts, snow piles, cones). Well-implemented systems address these through targeted model training, sensor fusion with complementary detection methods, and time-based logic for persistent occupancy anomalies.
Further Reading From Authoritative Sources
- Transportation Research Board — Parking and Occupancy Research: TRB’s NCHRP and TCRP programs have funded multiple field evaluations of parking occupancy detection technologies including camera-based systems, with performance data across diverse deployment conditions.
- FHWA — Intelligent Transportation Systems for Parking Management: The Federal Highway Administration documents ITS applications including advanced detection and guidance systems, with case studies from federally supported smart parking programs.